45 Top Augmented Reality (AR) Statistics
- Updated: Aug 29, 2024
- 3 min

CEO
Augmented Reality (AR) is becoming a part of our everyday lives — it’s now being used to enhance everything from shopping experiences to educational tools.
Unlike Virtual Reality (VR), AR adds digital information to the real world, blending physical and virtual elements in real-time. This integration has enormous implications for marketing, gaming, and workplace productivity.
In this article, we’ll explore the most fascinating AR statistics to understand its impact on our world and stay ahead in the digital age.
Bring your app idea to life with our expert software developers — contact us today to get started!
Augmented Reality Market Overview
- In 2023, the mobile AR market was worth $21.1 billion, while the AR software market reached $11.6 billion and the AR advertising market $4.3 billion.
- The AR & VR market is predicted to nearly double between 2025 and 2028.
- Mobile AR market revenue is expected to top $39 billion in 2027.
- The AR market is projected to hit a value of $50 billion by 2028.
Consumer Interaction and Preferences with AR
- Nearly half of all consumers are likely to spend more on a product via AR-based shopping.
- The majority of consumers prefer AR-integrated shopping.
- Immersion is the most common reason for using AR.
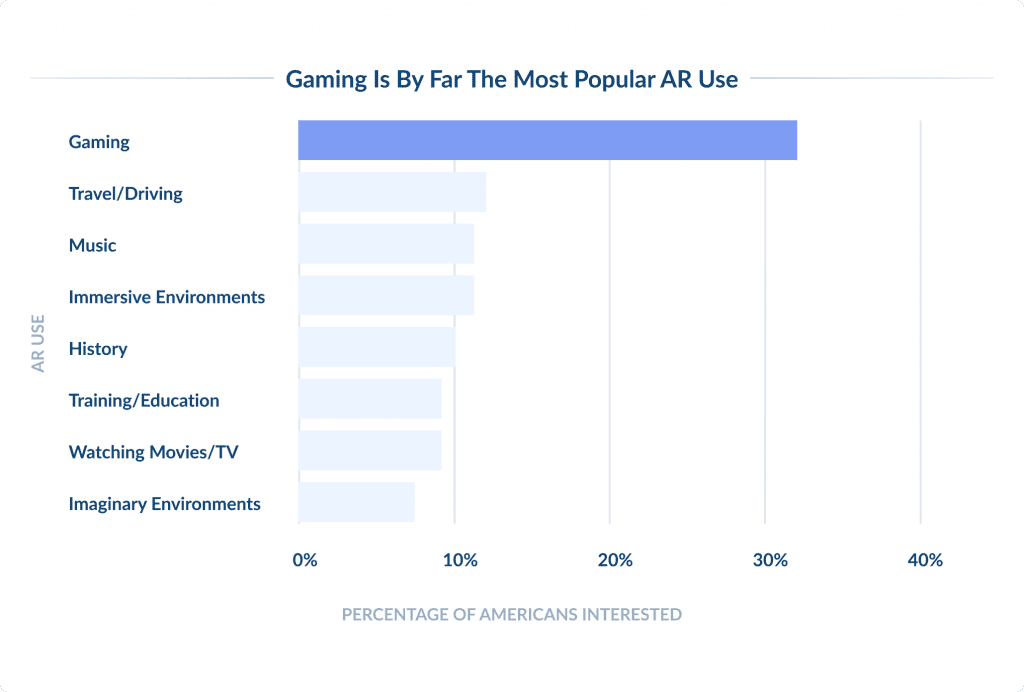
- Gaming is by far the most popular AR use.
- As many as 75% of 16 to 44-year-olds are aware of AR.
- Over 90% of Gen Zs are interested in AR shopping experiences.
- 7 in 10 shoppers believe AR apps would influence them to shop more often.
- 70% of tech leaders foresee AR revenue exceeding that of VR.
- Conversion rates are found to be 40% higher with AR.
- In 2022, retail accounts for 5% of AR use.
- Two-thirds (67%) of advertising agencies are increasing their AR usage.
- 64% of customers feel AR usage boosts their brand loyalty.
- Over two-thirds of US residents foresee AR becoming a routine part of life in the coming years. 82% expressed their intent to use AR and VR more frequently.
- Approximately one-third (32%) of Americans are interested in playing AR video games.
- 38% of users expressed the need for advancements in AR to make gameplay more engaging.
- 40% of AR gamers agree that AR gaming will be more enjoyable with more immersive games and access to lower-cost AR glasses.
Optimize Your Development Lifecycle with DevOps Experts.
AR in Retail and Advertising
- Only 1 in every 100 retailers are utilizing AR to sell products.
- The first AR advertisement debuted in 2008 for BMW’s MINI campaign.
- More than half (52%) of retailers need more time to be ready to integrate AR into their retail systems.
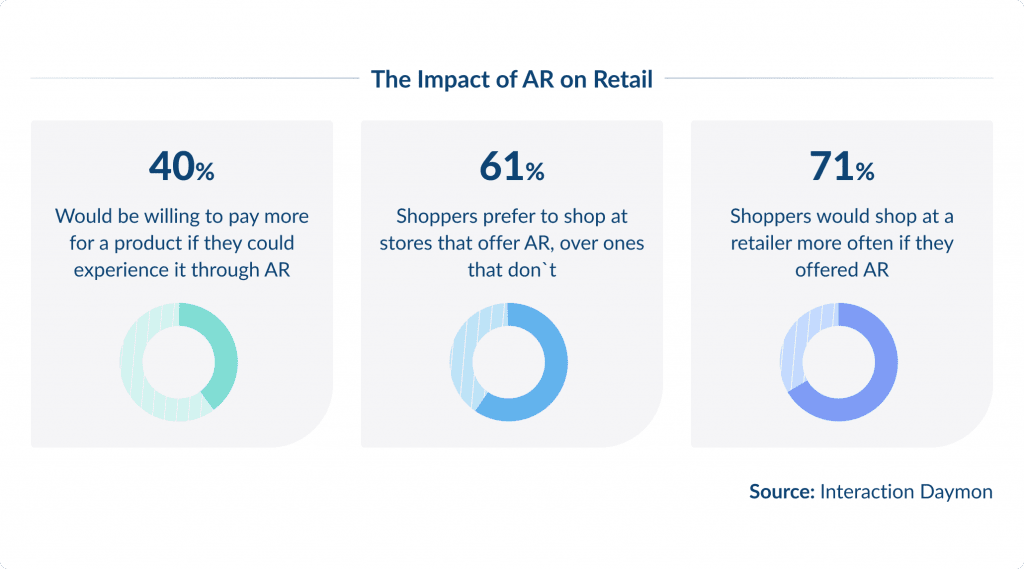
- 61% of consumers prefer retailers offering AR experiences.
- 71% of shoppers would frequent stores more if they implemented AR.
- Most Japanese consumers (66%) want offline stores to provide AR experiences.
- Two-fifths of consumers (40%) are willing to pay more for products customizable in AR.
- 32% of consumers incorporate AR in their shopping routine.
- A total of 100 million consumers shopped with AR in 2020.
- More than half (55%) of consumers find shopping with AR more entertaining.
- 91.75% of Gen Z shows a strong interest in AR-based shopping.
- AR shopping interest is higher among younger generations, with 94% of Gen Z interested in AR furniture placement.
AR User Statistics and Devices
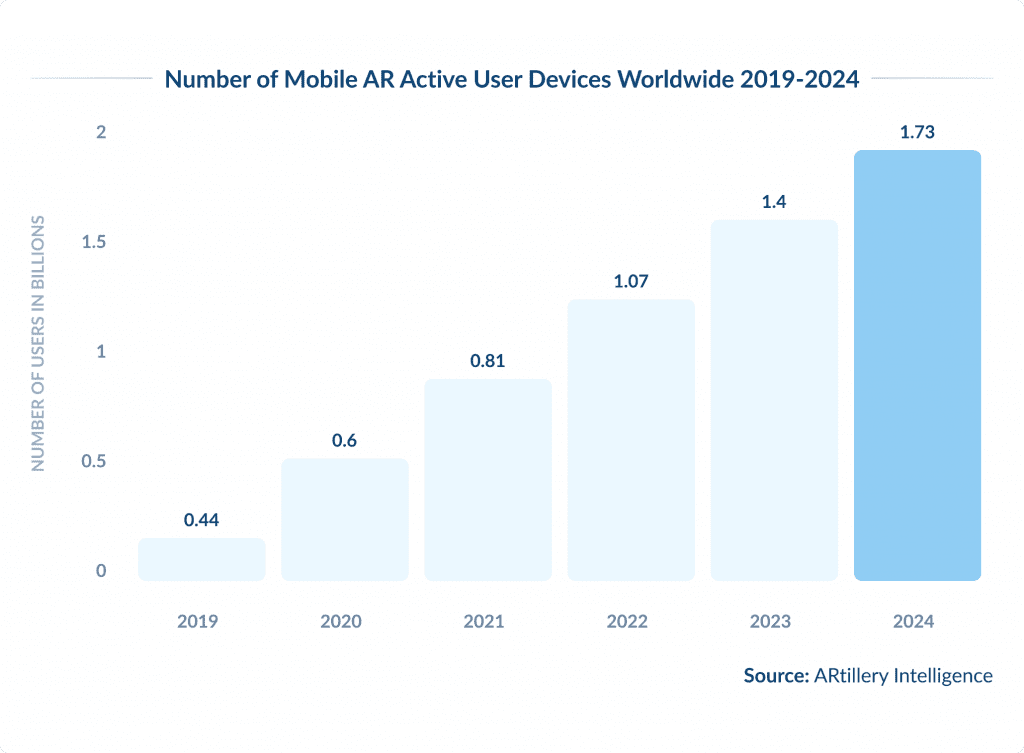
- There are an estimated 1.73 billion active AR user devices.
- AR device users will grow steadily, reaching approximately 1.4 billion by the end of 2023 and 1.73 billion by 2025.
- As of 2023, the US is home to 1,027 AR startups, reflecting a significant increase in recent years.
- 26% of all smartphones support AR.
Expertise gap? Let's bridge it together. Share your needs and elevate your team with our experts.
AR Market Value by Segment and Specific Technologies
- The AR agriculture market is worth over half a million USD.
- The AR and AI manufacturing segment is expected to double in value between 2025 and 2030.
- The value of AR in offices could increase by up to 10x in five years.
- The value of AR in hospitals could reach $90 billion by 2030.
- The AR vehicle space will double in value between 2025 and 2030.
- AR glasses revenue is expected to increase by over 5x between 2023 and 2025.
- Micro LED AR glasses display chip market revenue is set to increase by over 400x in three years.
- The AR headset market is expected to ship 50 million units in 2025.
Conclusion
AR is set to transform how we shop, learn, and fix things. It’s becoming a part of daily life thanks to better phones and new AR glasses.
As AR grows, the focus is on making it fit smoothly into our lives and ensuring it’s helpful and accessible for everyone.
Sources