44 Top Virtual Reality (VR) Statistics
- Updated: Mar 17, 2026
- 3 min

CEO
Virtual Reality (VR) has come a long way from being a niche form of entertainment to a tool with profound uses in education, healthcare, and real estate.
In 2025, VR technology will be more immersive and accessible than ever, changing how we interact with digital environments.
In this article, we’ll be exploring some key VR statistics to better understand where the VR industry is today and where it’s headed in the near future.
Ready to enter the education tech field? Feel free to discover EdTech startup ideas that can change how people learn and grow.
Bring your app idea to life with our expert software developers — contact us today to get started!
Market Overview
- In 2023, the VR market reached a total size of $15.8 billion, with $9.4 billion being contributed by the hardware market and $2.8 billion by the gaming market.
- In 2022, VR users grew to over 171 million users.
- Over 10.8 million VR devices were sold in 2022 (23.8 million by 2025).
User Statistics and Demographics
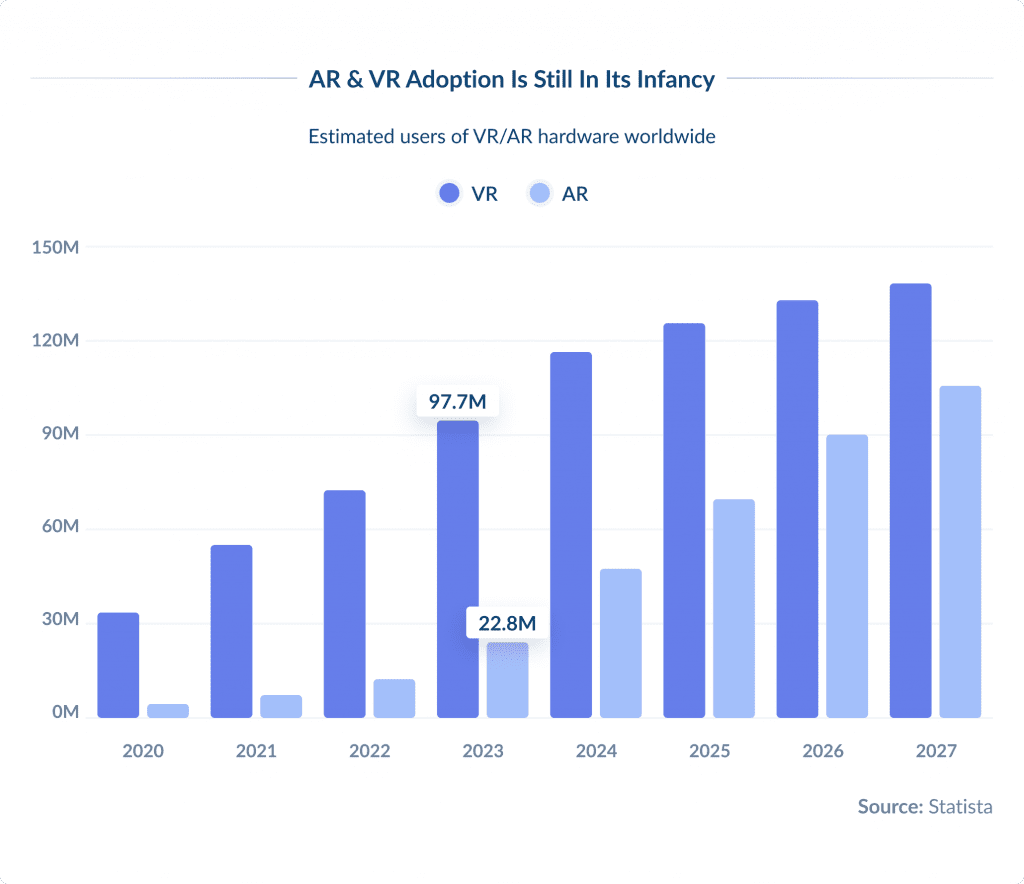
- An estimated 64 million Americans used virtual reality in 2022.
- 101.6 million people in the U.S. use augmented reality.
- Almost one-third of VR users use virtual reality at least monthly.
- The total number of active virtual reality users in 2022 is over 171 million.
- By 2025, the worldwide AR/VR gamer user base will increase to 216 million users.
- 43% of consumers who used VR in the past month own VR headsets.
- 45% of VR users are Gen-Z.
- 37% of VR users have a household income of over $100,000.
- The fastest growing VR market is Asia Pacific, but the largest VR market remains the U.S.
Industry Worth and Consumer Spending
- The global combined AR/VR/MR market is worth over $28 billion.
- By 2028, the global AR/VR/MR market will explode to over $252 billion.
- Consumer spending on VR/AR has a growth rate of 34%.
- Head-mounted display devices account for 60% of the global VR revenue share.
Adoption and Technology Trends
- Predictions show that 5.9 million Americans will adopt VR by next year.
- 23% of U.S. households own or have used a VR headset.
- 90% of U.S. consumers are aware of virtual reality, while just 65% are aware of augmented reality.
- Virtual reality headset sales are growing 31.9% year-over-year.
- Half of U.S. consumers think the virtual reality metaverse is “exciting.”
- Over 80% of manufacturers think VR will become mainstream.
Optimize Your Development Lifecycle with DevOps Experts.
Commercial Use and Business Perspective
- 75% of the world’s top brands have virtual reality projects underway.
- 46% of companies are hiring people with skills related to the metaverse.
- 82% of executives expect metaverse plans to be part of their business activity within 3 years.
- The investment in VR was expected to multiply 21x over the past 4 years.
- The number of virtual reality startups has grown by over 14%.
- In 2022, there were over 950 VR startups in the United States.
- 59% of company executives think investments made toward VR will be directed toward gaming.
- 5% of the top 1,000 Twitch channels streamed VR games at least once.
- A virtual reality theme park in China features over 40 VR rides.
Benefits of VR
- Virtual and augmented reality could deliver a £1.4 trillion boost to the global economy by 2030.
- Over 23 million jobs will depend on VR by 2030.
- 65% of consumers want to explore new places virtually.
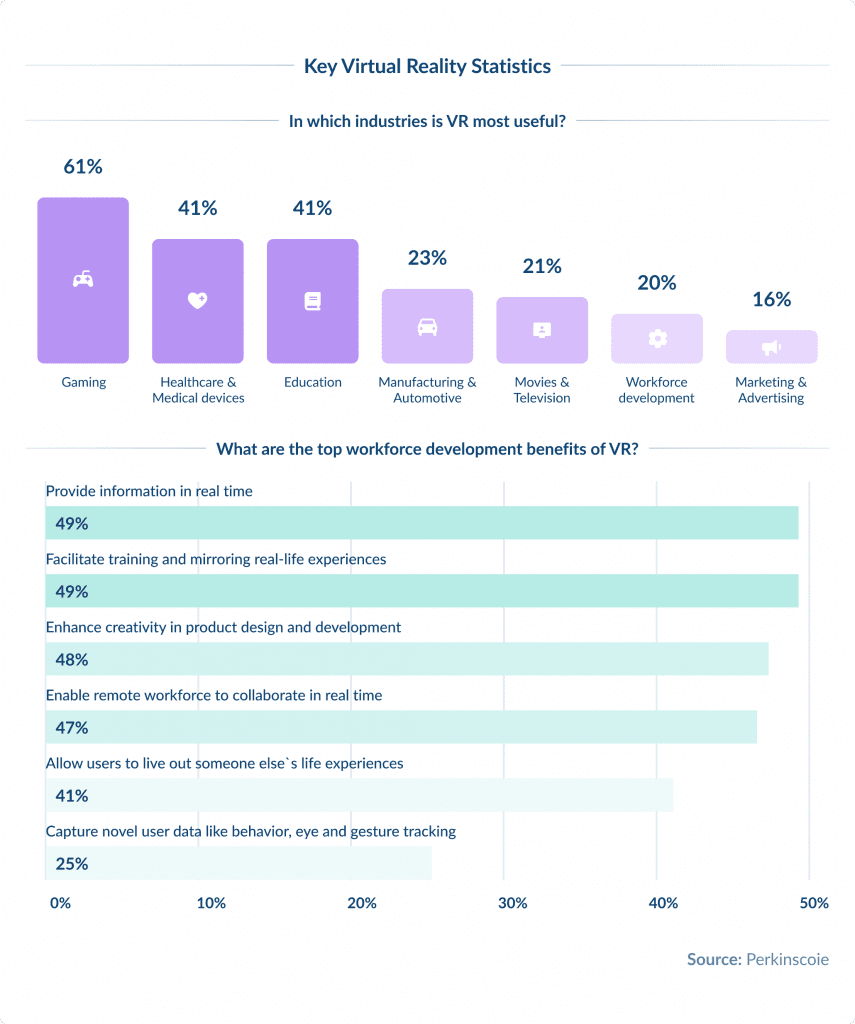
- 52% of consumers want to attend virtual courses and training.
- VR learners were 4x faster to train than in-classroom learners.
- Cause-based VR films inspire twice as many donations as normal films.
- Virtual reality experiences attract 15% more responses than direct marketing.
- VR within the engineering industry can decrease model design time by 10%.
- VR in the healthcare segment has a projected CAGR of 19.3% from 2022 to 2030.
Adoption Barriers and Concerns
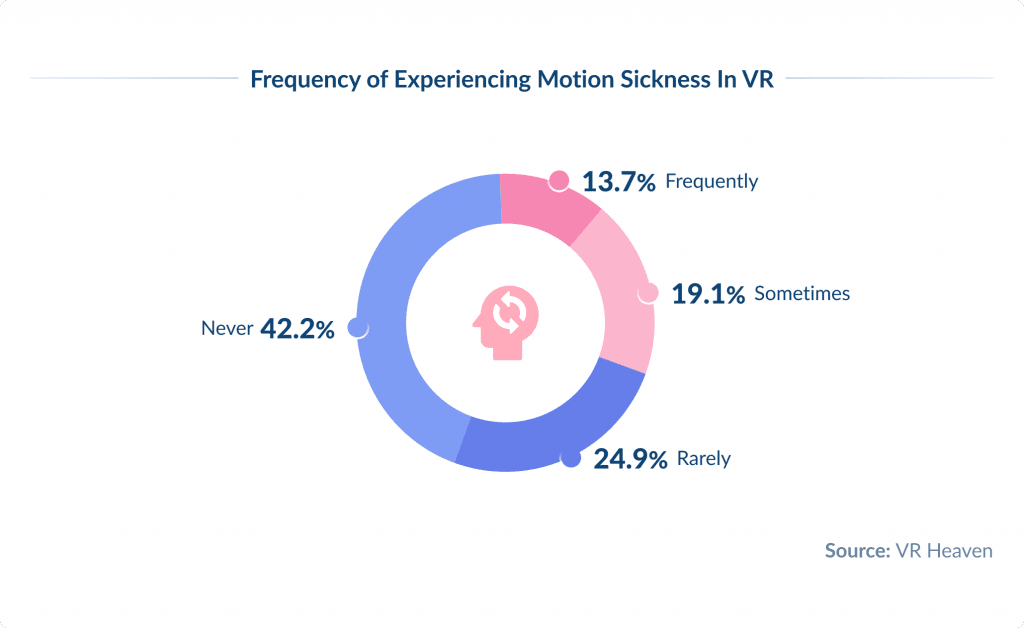
- When it comes to factors hindering VR adoption, content offerings (27%) are the top obstacle, followed by user experience (19%), business and consumer reluctance (19%), regulation and legal risks (12%), the cost to consumers (11%), and financing and investment (9%).
- On the AR side of things, the biggest barriers are user experience (32%), content offerings (18%), business and consumer reluctance (15%), regulation and legal risks (14%), financing and investment (11%), and cost to consumers (7%).
- The biggest concerns for investors in VR startups include the lack of an established market for technology (46%), untested technology (38%), slow business adoption (38%), slow consumer adoption (32%), and lack of trusted teams and technologies to invest in (13%).
Expertise gap? Let's bridge it together. Share your needs and elevate your team with our experts.
Conclusion
VR is no longer just for games. It’s now used in schools, hospitals, and homes.
Although VR can be expensive and requires additional equipment, the future of VR is exciting, with new opportunities for learning, working, and playing.
Sources